


Last Updated on June 28, 2023 by Prepbytes

A well-designed database forms the backbone of any successful software application, ensuring efficient storage, retrieval, and manipulation of data. At the heart of this design lies the Entity-Relationship (ER) model, a conceptual framework that helps developers and database administrators capture the intricacies of real-world entities and their relationships.
The ER model in DBMS serves as a powerful tool for visualizing and mapping the various entities, attributes, and associations within a database system. By employing a simple yet comprehensive set of concepts and notations, the ER model provides a clear and intuitive representation of complex data structures, enabling effective communication between stakeholders and facilitating the creation of robust databases.

What is an ER Diagram?
An ER diagram, also known as an Entity-Relationship diagram, is a graphical representation that visually depicts the entities, attributes, and relationships within a database system. It serves as a blueprint for designing and understanding the structure of a database, allowing stakeholders to visualize the connections between different components.
The ER diagram captures the conceptual view of a database, focusing on the entities (objects or concepts of interest) and their relationships. Entities can represent real-world objects, such as customers, products, or employees, or abstract concepts like events or transactions. Each entity is depicted as a rectangle in the diagram, labeled with its name.
The relationship between the two entities Student and Course is shown in the above diagram. As a course may be chosen by many students and a student can choose more than one course, the relationship between student and course is stated as being many-to-many. Student entities possess attributes – Stu_Id, Stu_Name & Stu_Age. The course entity has attributes such as Cou_ID & Cou_Name.
ER Model in DBMS
The ER model, short for Entity-Relationship model, is a conceptual framework used in database management systems (DBMS) to represent and design databases. It allows database designers to capture the relationships between entities, define attributes, and establish constraints. The ER model serves as a bridge between the real-world domain and the logical structure of a database.
In the ER model, an entity represents a real-world object or concept that can be distinguished from other objects. Entities can range from tangible things like customers, products, or employees to abstract concepts like events or transactions. Each entity is uniquely identified by its set of attributes, which describe the characteristics or properties of the entity.
Now, let’s look into the history of ER model in DBMS
History of ER Models in DBMS
The history of the ER model in DBMS dates back to the early 1970s. The ER model was developed by Peter Chen, a computer scientist and professor at MIT, as a conceptual framework for database design and modeling.
Peter Chen introduced the ER model in his 1976 paper titled "The Entity-Relationship Model: Towards a Unified View of Data." The paper presented the fundamental concepts and notations of the ER model, emphasizing the importance of capturing entities, relationships, and attributes in database modeling.
Reason To Use ER Model in DBMS
ER diagrams, also known as Entity-Relationship diagrams, are widely used in database management systems (DBMS) for several important reasons:
- Visual Representation: ER diagrams provide a visual representation of the database structure, allowing stakeholders to easily understand and interpret the relationships between entities, attributes, and their connectivity. This graphical representation enhances communication and collaboration among designers, developers, and users involved in the database design process.
- Database Design: ER diagrams serve as a blueprint for database design. They enable designers to identify and define entities, attributes, and relationships, helping them conceptualize the structure of the database and establish the foundation for building a robust and efficient system.
- Requirements Analysis: ER diagrams aid in requirements analysis by capturing the essential elements of the domain being modeled. They help stakeholders identify entities and their attributes, as well as understand the relationships and dependencies between entities. This analysis ensures that the database design accurately represents the requirements of the system and the real-world domain it is intended to serve.
- Data Integrity: ER diagrams facilitate the identification and enforcement of data integrity constraints. By visually representing relationships and cardinality between entities, designers can define constraints that maintain the integrity and consistency of the data stored in the database. These constraints prevent data anomalies and ensure that the data conforms to the desired business rules and logic.
- Query Development: ER diagrams assist in query development and data retrieval. By understanding the relationships between entities, developers can optimize query design and leverage the connections between entities to retrieve data efficiently. ER diagrams provide insights into the structure of the database, aiding in the construction of complex queries and improving query performance.
- Database Maintenance and Evolution: ER diagrams simplify database maintenance and evolution. By documenting the structure and relationships within the database, ER diagrams serve as a reference for database administrators and developers when making modifications or extending the database schema. They provide a clear overview of the existing structure, making it easier to identify the impact of changes and ensure database consistency.
- Database Documentation: ER diagrams serve as documentation for the database system. They provide a visual summary of the database design, making it easier for new team members or stakeholders to understand the structure and relationships within the database. ER diagrams also serve as a reference for future enhancements, modifications, or troubleshooting.
Symbols Used in ER Diagrams
Below are the symbols that are used in ER Diagrams:
- Rectangles: This entity-type symbol is used in entity relationship diagrams.
- Ellipses: This symbol represents attributes.
- Diamonds: This symbol represents relationship types.
- Lines: It connects entities with other relationship types and with attributes.
- Primary key: Here, it underlines the attributes
- Double Ellipses: It represents multi-valued attributes

Components of ER Diagram
An ER Diagram is based on three fundamental ideas:
- Entities
- Weak Entity
- Attributes
- Key Attribute
- Composite Attribute
- Multivalued Attribute
- Derived Attribute
- Relationships
- One-to-One Relationships
- One-to-Many Relationships
- Many-to-One Relationships
- Many-to-Many Relationships
Entities
An entity can be a living being or a non-living thing. In an ER diagram, it displays an entity as a rectangle. For instance, the student and the course are both entities in a student study course.

- Weak Entity
A weak entity is one that relies on another entity for its existence.
In the ER Diagram, you display the weak entity as a double rectangle.
The fact that the school in the example below has the main key property "school number" makes it a strong entity. The classroom, unlike the school, is a weak entity as it lacks a primary key and the room number here merely serves as a discriminator.

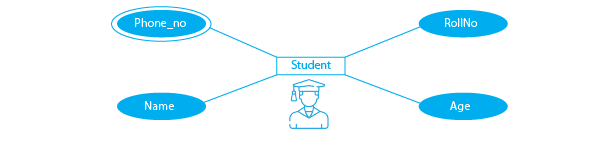
Attribute
An attribute displays an entity’s characteristics. In an ER diagram, an oval shape can be used to represent an attribute.

Types of Attributes:
There are four types of attributes that are discussed below:
- Key Attribute
An entity from a group of entities is uniquely identified by its key characteristic. It underlines a crucial attribute’s text in the text.
The roll number, for instance, can be used to distinguish one student from another in a group of students.

- Composite Attribute
A composite characteristic is one that is made up of many other attributes.
The composite attribute is represented by an oval, which is further related to additional ovals.

- Multivalued Attribute
Multivalued attributes are those where an attribute can have many values.
A multivalued attribute is represented by a double oval shape.
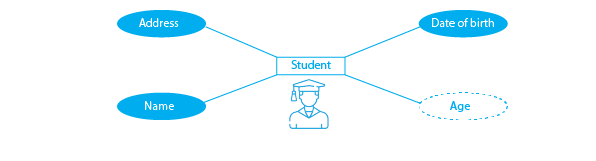
- Derived Attribute
A derived attribute is one that may be derived from the entity’s other characteristics.
The derived attribute is represented by the dashed oval in the ER diagram.
Relationship
In the ER diagram, a relationship can be seen in the diamond shape.
It demonstrates the connections between the two items.
In the scenario below, the student and the course are viewed as different entities, and study is the interaction between them.

Types of Relationships
Mainly we have four types of relationship in ER model:
- One-to-One Relationship
A one-to-one connection exists when a single element of one entity is connected to a single element of another entity.
For instance, a student only has one ID, and only one individual is allowed to have an ID.

- One-to-Many Relationship
A one-to-many connection exists when a single element of one entity is connected to several elements of another entity.
For instance, a consumer can place several orders, but many customers cannot place the same order.

- Many-to-One Relationship
A many-to-one connection is one in which more than one element of one entity is connected to only one element of another.
For instance, although only one course is available, students may enrol in many courses.

- Many-to-Many Relationship
A many-to-many connection exists when several elements of one entity relate to multiple elements of another entity.
An employee, for instance, may be assigned to several projects, and a project may have several employees.

How to Draw an ER Diagram?
Below are some important points to draw ER diagram:
- Identify each Entity first. Put each entity inside a rectangle and give it a descriptive name.
- Establish connections between entities that are related to one another by placing a diamond in the middle to signify the connection. Do not relate relationships to one another.
- Connect entity characteristics and give them the appropriate labels.
- Eliminate any linkages or entities that are unnecessary.
- Make sure your ER Diagram can accommodate all the information used to create the database.
- Use colour to draw attention to important regions in your diagrams.
Features of ER Model
The features of ER Model are as follows −
- ER Diagram: The diagrams that are drawn up to design the database are called ER diagrams. They are built on the basis of three fundamental ideas: entities, characteristics, and connections between them. We specify the entities, their associated properties, and the relationships between them in the ER diagram. This aids in demonstrating the databases’ logical structure.
- Database Design: The Entity-Relationship model supports database designers in creating databases in an extremely straightforward and logical way.
- Graphical Representation helps in Better Understanding: Because ER diagrams are so straightforward to read and comprehend, developers may utilise them with ease to communicate with stakeholders.
- Easy to build: The ER model is fairly simple to construct.
- The extended E-R features: Specialization, upper- and lower-level entity sets, attribute inheritance, aggregation, and generalisation are a few of the other elements of the ER paradigm.
- Integration of ER model: This model is frequently used by database designers to convey their ideas and may be included in a dominating common relational model.
- Simplicity and various applications of ER model: It offers a sneak peek of how all your tables should interact and what fields each table will have, serving as a template for integrating data into certain software programs.
Conclusion
The ER Model in DBMS is a powerful conceptual framework that allows for effective database design and modeling. It provides a clear and intuitive representation of entities, attributes, and relationships within a database, enabling stakeholders to visualize and understand the structure and connectivity of the data.
The ER model plays a vital role in the early stages of database development, aiding in requirements analysis, data modeling, and communication between stakeholders. By capturing the essence of real-world entities and their relationships, the ER model serves as a blueprint for creating well-structured and efficient databases.
FAQs related to ER Diagram in DBMS
Q1: What are the key components of an ER model in DBMS?
The key components of an ER model include entities, attributes, relationships, primary keys, foreign keys, and constraints. Entities represent real-world objects, attributes describe their properties, relationships establish connections between entities, and keys enforce uniqueness and integrity.
Q2: How is an ER model different from a relational model?
The ER model focuses on the conceptual design of a database, capturing entities, relationships, and attributes, while the relational model deals with the logical and physical implementation of the database using tables, rows, and columns.
Q3: Can the ER model handle complex relationships?
Yes, the ER model can handle complex relationships through various techniques such as one-to-one, one-to-many, many-to-many relationships, as well as recursive relationships and ternary relationships.
Q4: Can the ER model be used for any type of database?
Yes, the ER model can be used for a wide range of databases, including relational databases, object-oriented databases, and NoSQL databases. It provides a conceptual foundation that can be adapted and extended to different database paradigms.
Q5: What is the role of cardinality in the ER model in DBMS?
Cardinality in the ER model specifies the minimum and maximum number of instances that can participate in a relationship. It helps define the connectivity and multiplicity between entities, ensuring accurate representation of the real-world relationships in the database.
Q6: Are there any limitations to the ER model in DBMS?
The ER model may face challenges in representing certain complex scenarios or dynamic aspects of a database system. In such cases, extensions or additional modeling techniques may be needed, such as the Enhanced Entity-Relationship (EER) model or UML (Unified Modeling Language) diagrams.